AI Doesn’t Run on Hype. It Runs on Gigawatts.

Just two months ago, AI infrastructure stocks were tumbling. Investor confidence was shaken, and whispers rippled through the market that Big Tech might be pulling back. Even Microsoft, a core pillar of the AI boom, was rumored to be slowing its data center expansion. The narrative was shifting—from boundless optimism to skeptical restraint. But here’s […]
Welcome to Agentic Retail: Walmart’s Sparky Redefines the Ecommerce Experience
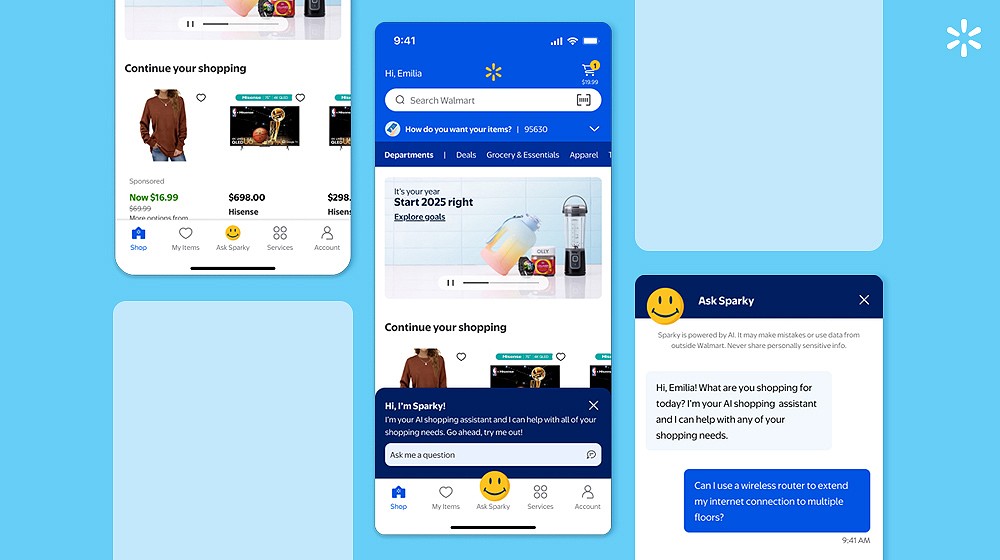
Walmart’s latest move hints at the future of ecommerce: shopping won’t just be done, it’ll be delegated. Walmart just introduced Sparky, signaling a shift from transactional shopping to agentic retail, where the assistant does the searching, comparing, recommending, and planning. Sparky is a generative AI shopping assistant that doesn’t just find what you’re looking for, […]
The UK Just Rewrote the Rulebook on Government Work—with AI at the Center
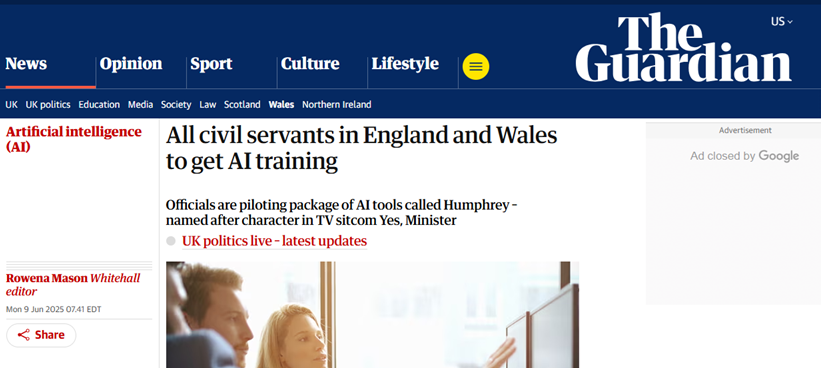
The UK is kicking off the largest AI reskilling effort in government history. This isn’t just policy reform, it’s a fundamental change in how bureaucracies operate. This fall, every civil servant in England and Wales, from Whitehall to Cardiff, will receive practical, working-level AI training. The UK is about to give 400,000+ civil servants AI […]
Invisible Debt, Everyday Essentials: What BNPL Use on Groceries Is Telling Us
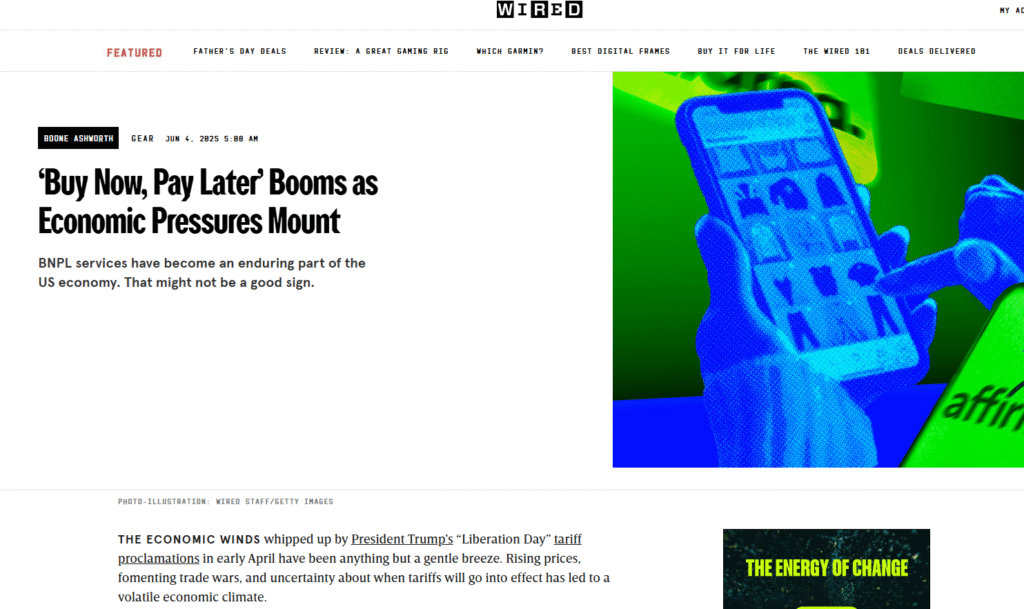
Americans are financing their groceries, and no one’s hitting the panic button. New reporting from WIRED‘s Boone Ashworth and The New York Times’ Julie Creswell highlights a growing reality: Buy Now, Pay Later (BNPL) options from firms like Klarna and Affirm are no longer just for TVs and treadmills. They are now being used for […]
The Equity Risk Premium Is Flashing Red. Are We Sleepwalking Into 2007?
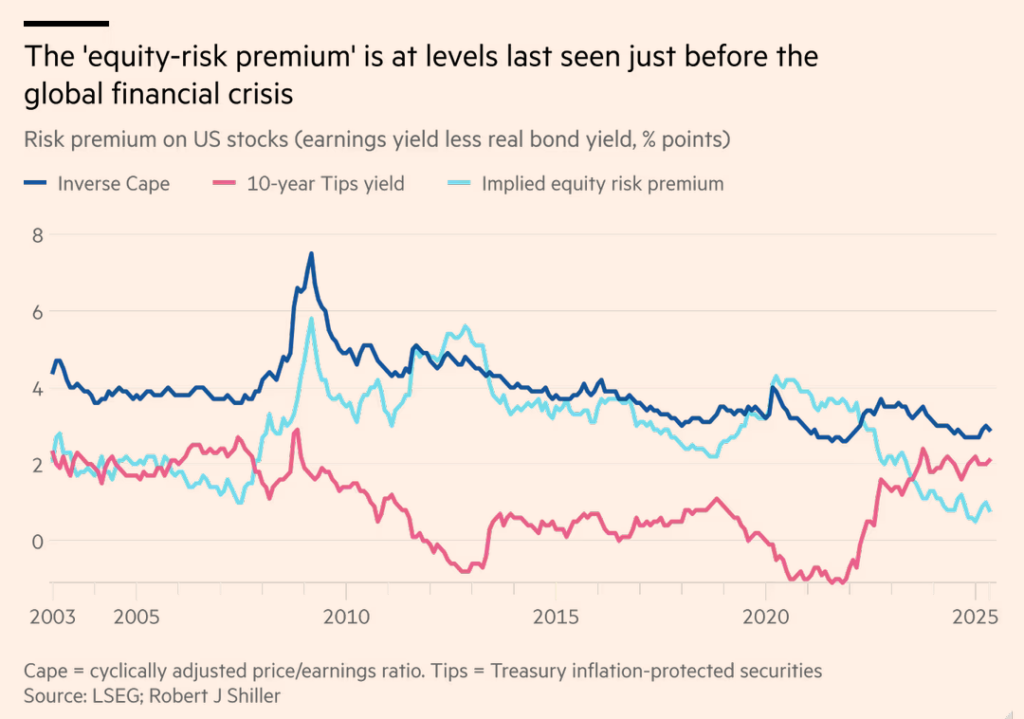
The equity risk premium is back to 2007 levels. What are the markets missing? Martin Wolf flagged something in the Financial Times that I’ve been quietly concerned about. The spread between the real bond yield and the cyclically adjusted earnings yield is now as low as it was in June 2007. Yes, that June 2007. […]
Costco’s Tariff Strategy Is a Masterclass in Real-Time Resilience
What we can learn from @Costco’s tariff playbook Last quarter, Costco Wholesale pulled forward patio furniture shipments and rerouted tariff-impacted goods to non-U.S. markets. They ate the cost of higher tariffs on pineapples and bananas from LATAM to protect members, but let flower prices rise, seeing them as more discretionary. Why? Because U.S. tariffs are […]
Will Google Kill the Zoom Square?

Here comes Google Beam, a sleek evolution of its Project Starline, freshly commercialized with HP, promising to turn video chat into something much more lifelike, immersive, and maybe even… enjoyable? Beam swaps out the flat rectangle for a 3D “magic window.” A six-camera array and real-time AI stitching build a volumetric model of your conversational […]
UBS Bets on Synthetic Communication

For decades, investment banks sold exclusivity. Human contact, tailored briefings, private calls. Analyst notes weren’t just information; they were status. Now, UBS is flipping that logic. Using OpenAI and Synthesia, the bank is turning select analysts into scalable content assets, replicating their likenesses and voices to generate videos that can be watched by thousands, on […]
AI Won’t Fix Your Productivity Problem—But Rethinking Work Might
AI won’t fix your productivity problem. Too many leaders treat AI like magic, plug it in and wait for results. But productivity gains don’t come from better tools. They come from better thinking. Get back to first-principles.What is the job we are trying to get done?What is the value we are delivering? To unlock AI’s […]
From Labs to Living Rooms: The Robotics Sputnik Moment May Have Just Arrived
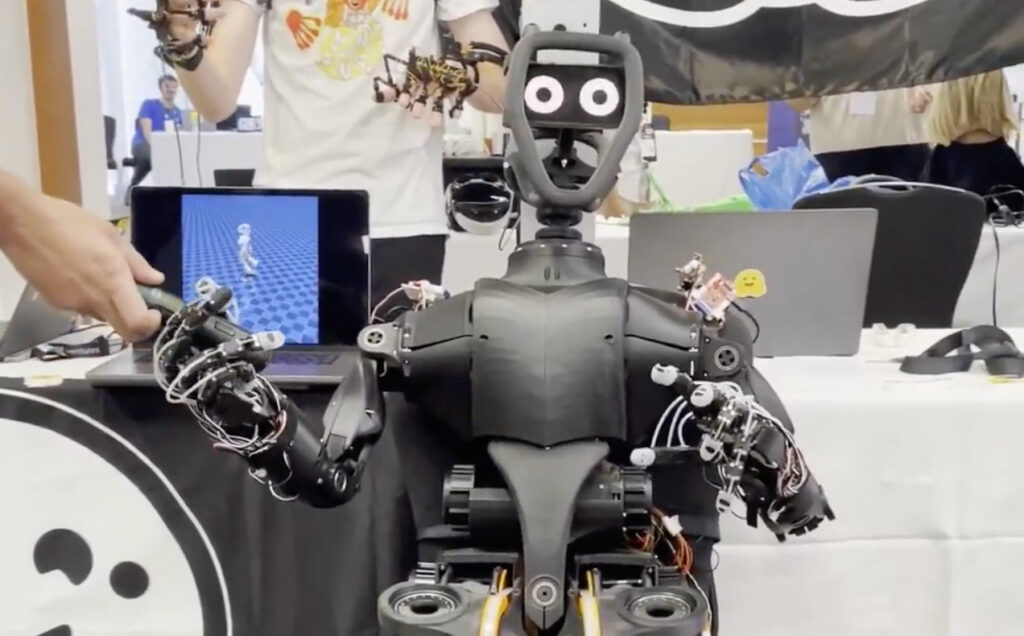
For years robots were million-dollar machines locked inside labs like Defense Advanced Research Projects Agency (DARPA), NASA Jet Propulsion Laboratory, Honda Research Institute USA, Inc., and Boston Dynamics Now? Hugging Face just dropped two open-source humanoid bots. One walks and talks. One fits on your desk. The cheapest one costs less than my most recent […]