A lot of ink is spilled on the ownership rate of devices, but often overlooked or at least underexamined is the average number of each device owned by households that own the device at all. While aggregate ownership rates speak to the adoption cycle, the number of devices owned by owning households have important implications for upgrade cycles (I wrote about adoption cycles and upgrade cycles here). The average number of units owned per owning households for a given device are some of the most valuable statistics to come out of CEA’s annual Consumer Electronics Ownership and market Potential Study.
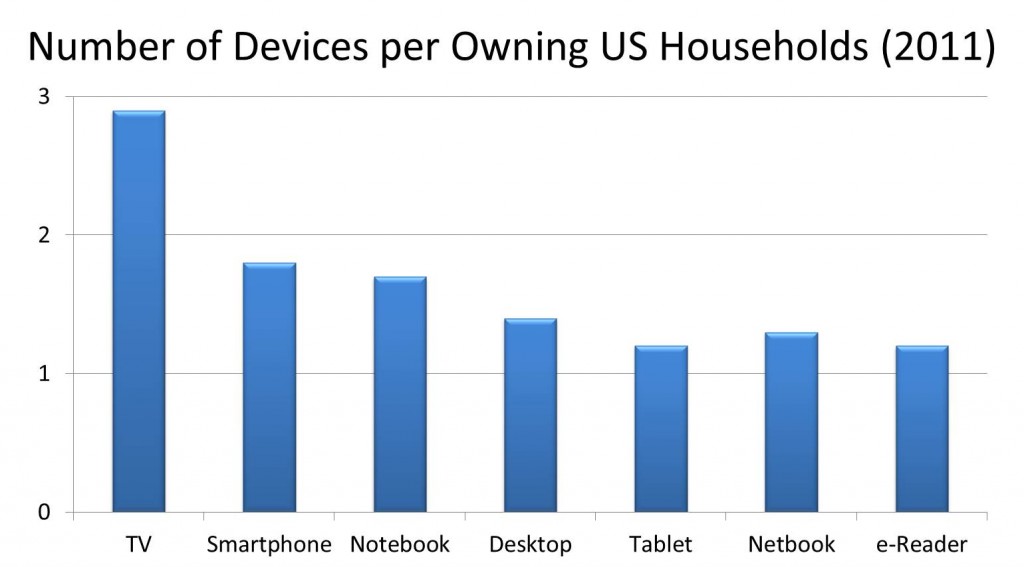
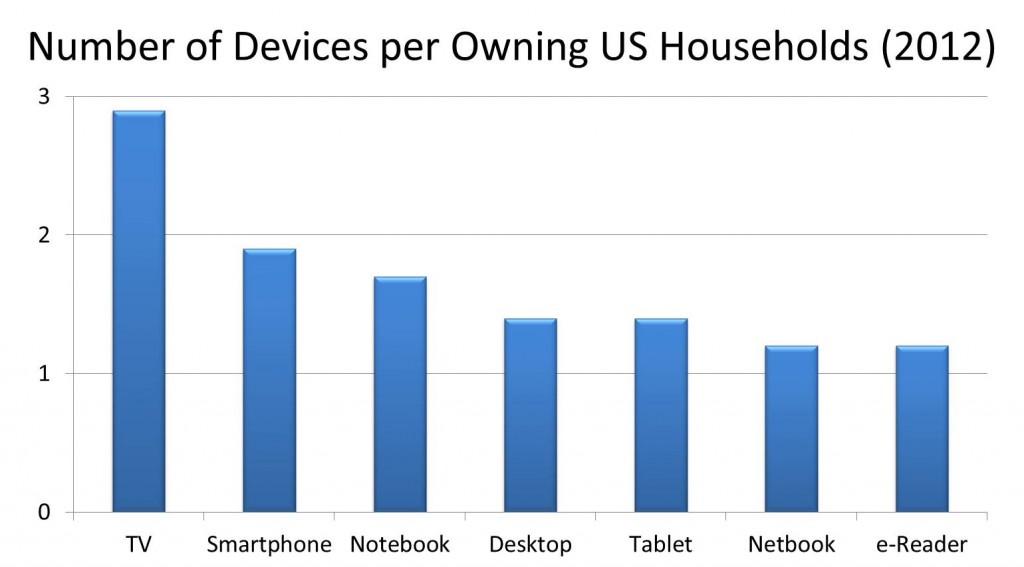
The chart below highlights the average number of units owned by owning households for a select list of devices in 2011 and 2012 respectively.
These numbers ultimately tell us at what rate a given technology is diffusing across members of the same household. The average number of smartphones for example has steadily been increasing over the last few years. At the same time, broad ownership has increased. So not only has the technology grown within non-owning households (adoption), but it is also growing within owning households. Not to confuse this with broad adoption or diffusion of a technology, I’ll refer to this as within-household diffusion.
Technology purchasing has three key rates of growth. You can think of these as individual states, but they always follow each other sequentially. In the first state, growth rates are increasing at an increasing rate. In mathematical terms – both the first and second derivative are positive. In the second state, the first derivative is positive, but the second derivative turns negative. In other words, purchases of the product are increasing, but they are doing so at a decreasing rate. Sales are still positive, but they are slowing. In the third and final state, the first derivative turns negative. In other words, period-over-period growth is now negative. Sales are shrinking.
When looking at adoption and ultimately sales projections, the key is to identify inflection points in the growth profile of a product. We want to pinpoint when a given product or service will move across these three states – moving from one state to the next. So now let’s look at these numbers.
The first thing to note is that average ownership rates per owning household differ across devices. TVs are the highest on the list (and the highest of any consumer tech product) at an average 2.9 units per owning household. e-Readers are the lowest on this list at an average of 1.2 units per owning household. From 2011 to 2012, the average number of units per owning household changed for only three of the devices listed. The average number of tablets per owning household increased from 1.2 to 1.4, the average number of smartphones per owning household edged up .1 to an average 1.9 units per owning household, and netbooks slipped from 1.3 to 1.2 average units per owning household.
What might all of these numbers suggest and what are the implications for upgrade cycles? First, there is a quantitative component and a qualitative component related to an increase or decrease in the average number of devices owned by owning households. The quantitative component is related directly to the additional number of devices that would be purchased as part of an upgrade cycle.
Let’s look at tablet computers. Not only did the average number of tablets per owning household increase, but overall ownership rates (adoption rates) increased as well. Tablet computers are now owned by roughly 22 percent of US households. That figure of course also continues to rise. There are roughly 119 million US households – suggesting roughly 26.2 million households own a tablet computer. An increase of devices per household from 1.2 to 1.4 suggests roughly 5 million additional units given an ownership rate of 22 percent.
What is some of the qualitative feedback from these figures? I think you can identify devices approaching the third state by looking for devices that are experiencing a declining ownership rate within homes. In other words, the within-household diffusion rate is declining. Individuals aren’t passing the technology onto others within their home. This has negative implications for both adoption and future upgrade cycles. Fewer individuals with access to the technology means fewer nodes and therefore less out-of-home diffusion. It also means fewer devices to replace as part of an upgrade cycle.


