Equity markets continue to reach for new highs in 2013 – up over seven percent year-to-date and hitting new highs on Wednesday. As enter first quarter earnings seasons, it seems like an appropriate time to share my expectations for equity markets in 2013. Most of the following comes from the presentation I give in early March each year at CEA’s annual Economic Retreat. My assessment of current markets and expectations for 2013 haven’t changed significantly in the last month.
We are now four years into the stock market recovery. Over this time, equity prices are up roughly 130 percent since setting a low on March 9, 2009. Bull markets typically last 57 months and over that period are typically up 164 percent. With history as our guide stock prices should continue to increase for another year or so – presuming the current bull market looks like the past. We likely overshot on the downside and could certainly overshoot on the upside – suggesting a longer and stronger bull market than history would dictate. If history is our guide, the S&P500 would need to close at 1,786 in 9 months – up 13.9% from current levels – in the current bull market to achieve a return of 164 percent over 57 months.
The current consensus (bottom-up) estimate is calling for $112 in S&P500 operating earnings while the consensus (top-down) is calling for $111 in S&P500 operating earnings. The average Wall Street estimate is wrong.
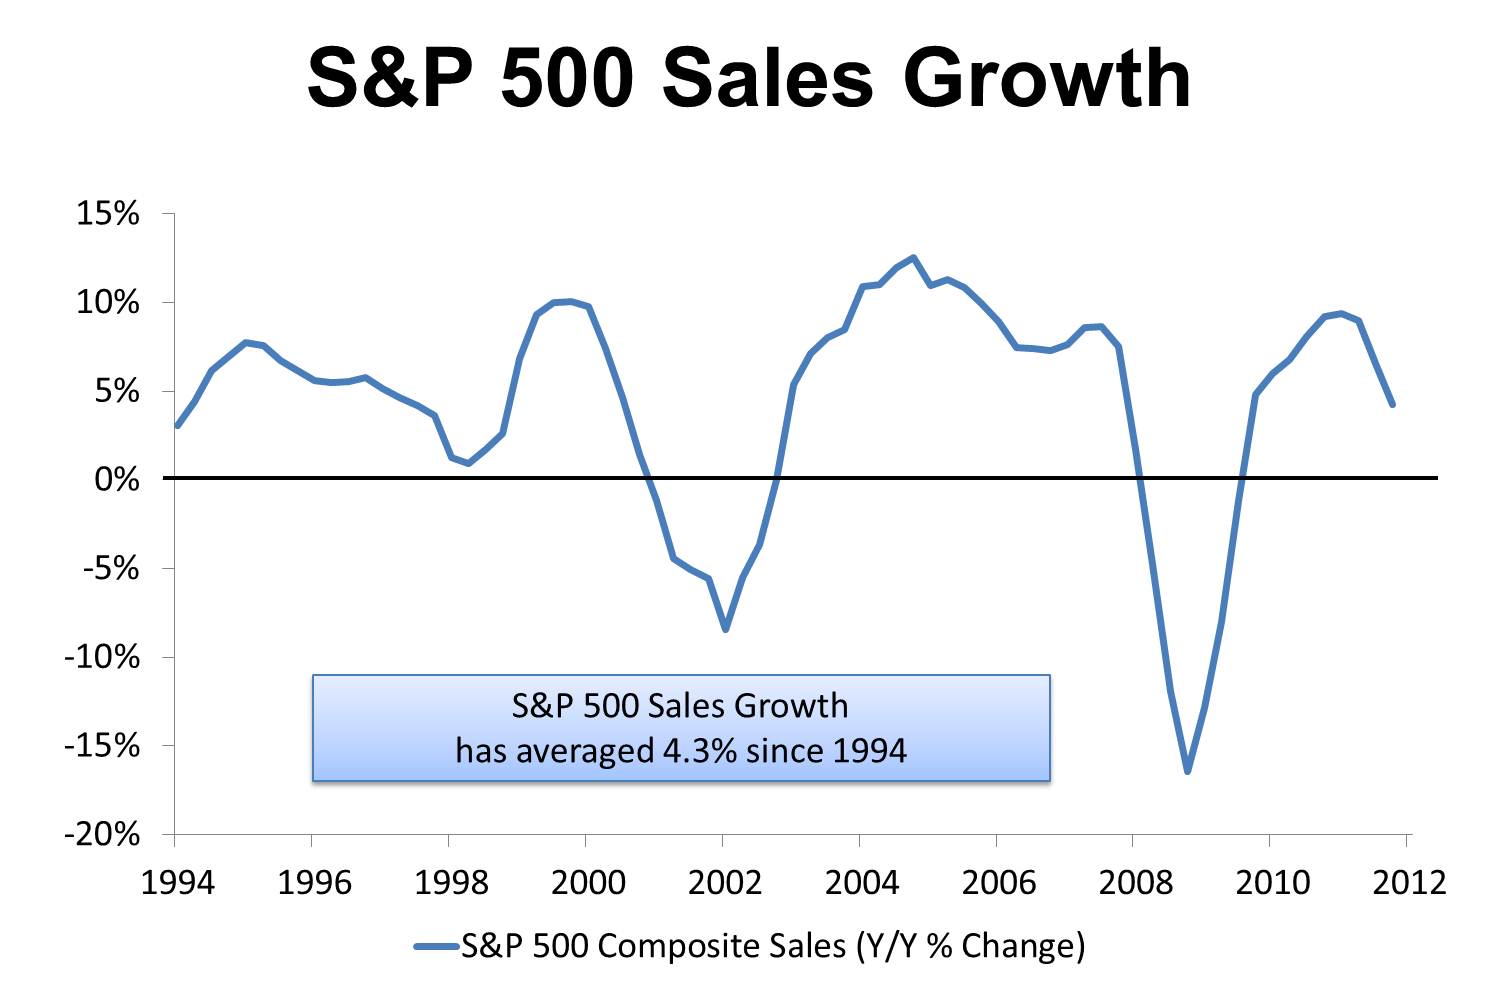
Let’s start with a simple approach to earnings estimates – operating earnings are a function of operating margin and sales growth. With that as our guide, let’s take a look at some history. In 2012, S&P 500 sales were approximately $1092. Operating margin was 8.9 percent in 2012 which equates to S&P 500 earnings of roughly $96.8. Sales revenue grew 3.8 percent in 2012. As you can see in the chart, S&P 500 sales growth has averaged 4.3 percent since 1994 and is also evident, sales growth has started to slow over recent few quarters.
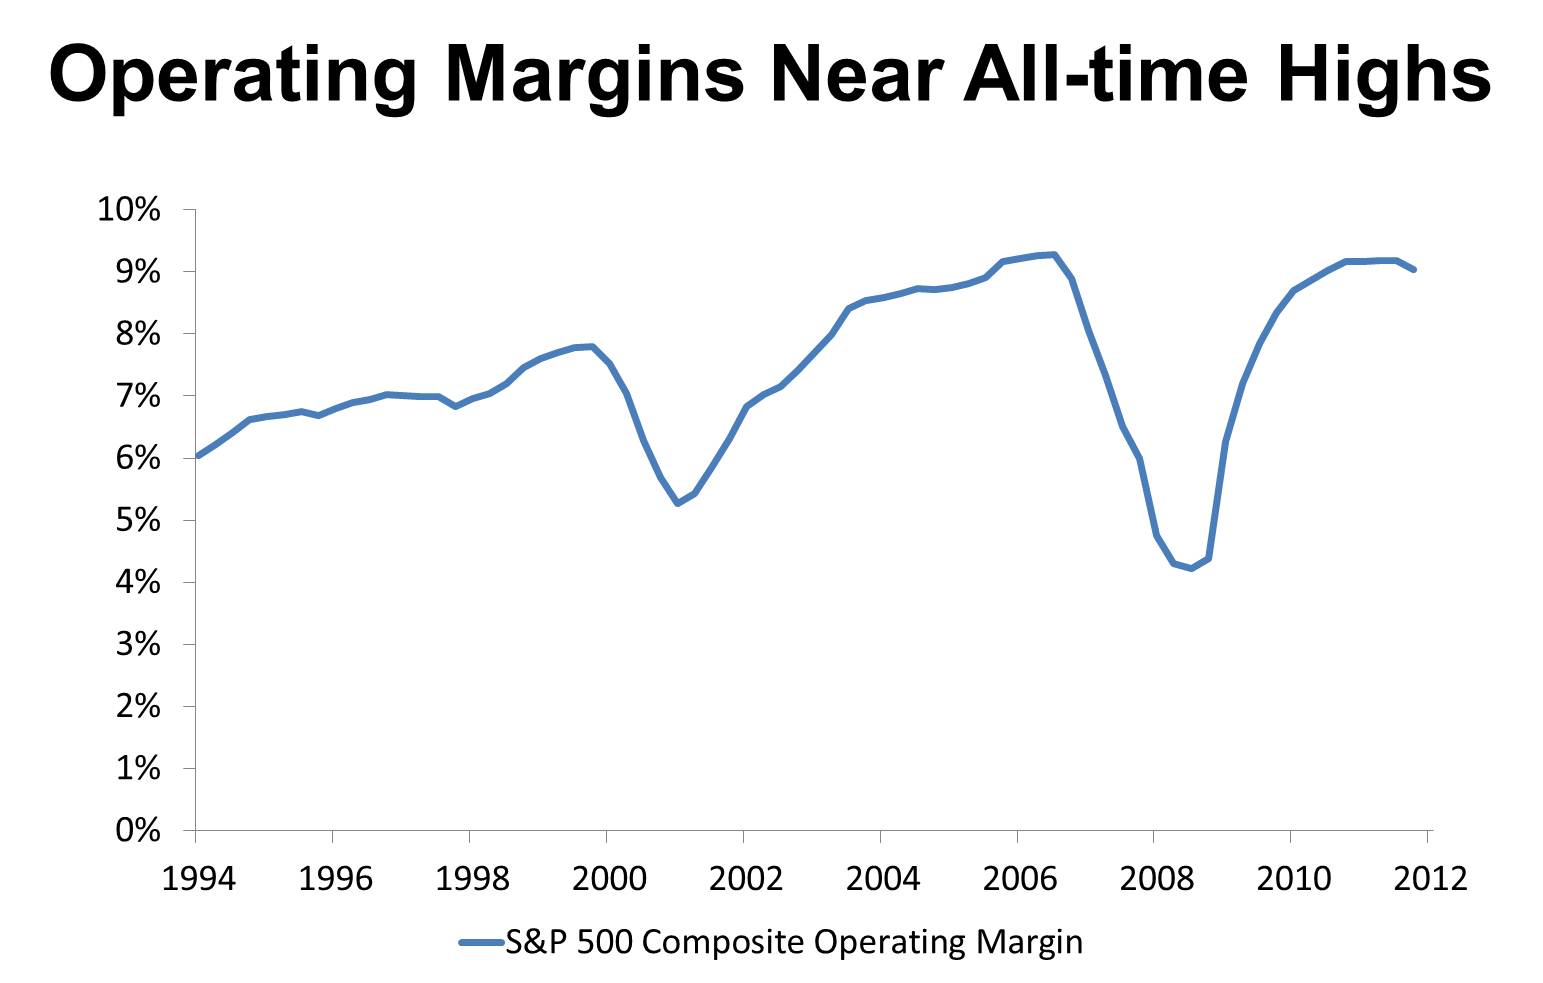
A similar story is true with operating margins. Operating margins have averaged 7.3 percent since 1994. At the 2012 level of 8.9 percent, operating margins are near all-time highs.
Let’s now pull these two things together. The chart below lays out a simple earnings estimate approach. As you can see, earnings growth and operating margin run along the axes. We are left with grid of possible S&P earnings. As the chart clearly shows, earnings expectations of $111-$112 requires certain sales growth and operating margin pairing.
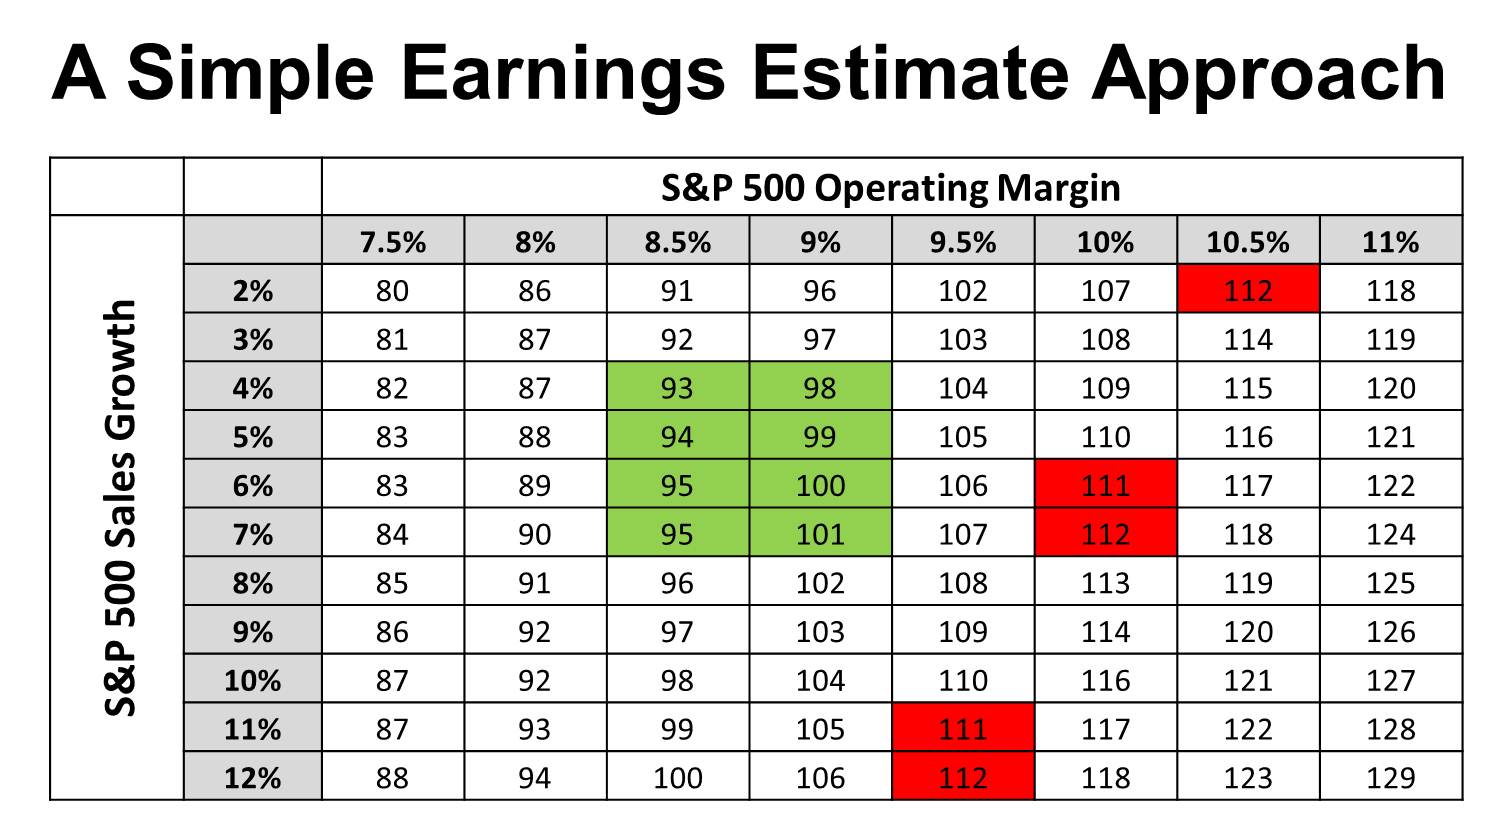
Sales growth of 11 to 12 percent paired with operating margin of 9.5 percent would produce earnings of $111 to $112 for the year. Similarly, you can achieve $111 to $112 in S&P 500 earnings with earnings growth of 6 percent and a higher operating margin of 10 percent. Finally, with sales growth of two percent operating margin must increase to 10.5 percent. The dilemma should be evident. To realize earnings in the $111 to $112 range, either sales growth must accelerate or operating margin must accelerate. Under either scenario, either sales growth must be above it’s current and long-run trend or operating margin must be above it’s current and long-run trend. Analysts have overestimated year-ahead S&P 500 earnings in 5 of the last 6 quarters.
More realistic expectations suggest earnings growth has some potential to possibly accelerate (and revert towards the mean), while operating margin declines slightly (and also reverts towards its mean). For 2013, I expect S&P 500 sales of $1,138 and operating margin in the range of 8.7 percent. This results in S&P 500 operating profits of $99 for 2013. With minimal growth in operating profit, most equity market appreciation will come from earnings multiple expansion and this is one area where I think expansion is warranted. Despite continued concerns of contagion risk from Europe, investors are starting to feel less risk averse.